Tuesday, December 31, 2019

Steady dividends beat investment volatility


Last March I published an article regarding the hazards of volatility in a stock selection.  In that example I compared a 4% annual dividend payer experiencing no growth against a non-div stock that experienced value swings up and down.

This post revisits that exercise but in a slightly different way.  As before, I started with a 4% dividend payer providing no value growth against a non-dividend stock that is uniformly volatile with regard to value.  In other words, the value of the stock increases a specific amount in one year then decreases a specific amount the following year. That pattern was repeated through 20 years.

I was trying to get a sense of how big stock gains have to be to offset corresponding declines over time while resulting in an outcome close to the straight 4% growth path.  The table below, built in excel, shows the results.

Start
 $  10,000.00
Annual Growth
 $     10,000.00
Annual Growth
1
 $  10,400.00
4%
 $     12,000.00
20%
2
 $  10,816.00
4%
 $     10,800.00
-10%
3
 $  11,248.64
4%
 $     12,960.00
20%
4
 $  11,698.59
4%
 $     11,664.00
-10%
5
 $  12,166.53
4%
 $     13,996.80
20%
6
 $  12,653.19
4%
 $     12,597.12
-10%
7
 $  13,159.32
4%
 $     15,116.54
20%
8
 $  13,685.69
4%
 $     13,604.89
-10%
9
 $  14,233.12
4%
 $     16,325.87
20%
10
 $  14,802.44
4%
 $     14,693.28
-10%
11
 $  15,394.54
4%
 $     17,631.94
20%
12
 $  16,010.32
4%
 $     15,868.74
-10%
13
 $  16,650.74
4%
 $     19,042.49
20%
14
 $  17,316.76
4%
 $     17,138.24
-10%
15
 $  18,009.44
4%
 $     20,565.89
20%
16
 $  18,729.81
4%
 $     18,509.30
-10%
17
 $  19,479.00
4%
 $     22,211.16
20%
18
 $  20,258.17
4%
 $     19,990.05
-10%
19
 $  21,068.49
4%
 $     23,988.06
20%
20
 $  21,911.23
4%
 $     21,589.25
-10%
Advantage
1%

If a $10,000 portfolio achieves 20% growth in year one but declines 10% in year two and repeats that pattern through 20 years, the volatile portfolio lags the steadily compounding portfolio by 1%.  This example assumes no money was added or subtracted from the portfolio.

If the value gains  are moved to 21% each year while holding the 10% declines steady, the volatile portfolio outperforms.  However, if value gains fall below 20% while the 10% declines remain constant, the performance advantage offered by the constant growth portfolio widens considerably.
Things to consider given the example above:
  • Gains have to be significantly greater than losses for a volatile portfolio to achieve parity with a constant growth option.
  • Losses should be mitigated as much or as often as possible for a volatile portfolio to achieve parity with a constant growth model.

The effects of volatility perfectly illustrate the following investing wisdom:

"The key to success [in investing] lies in avoiding losers, not in searching for winners."  -- Howard S. Marks

"Avoiding serious loss is a precondition for sustaining a high compound rate of growth."  -- Roger Lowenstein

"Rule #1:  Never Lose Money;  Rule #2:  Never Forget Rule #1."  -- Warren Buffett

Dividend Farmers don’t mind following the lead of successful investors.  On long journeys it’s often better to go with an experienced guide than venturing alone.  With the start of a new year we should keep learning, let the dividends compound, and work on steady growth.

Here’s to a success Dividend Farming effort in 2020.  Happy New Year!

Thoughts presented are those of the author, who is not a financial professional. Perspectives are not investment advice, but offered for the purpose of discussion and information. For specific investment advice or assistance, please contact a registered investment advisor, licensed broker, or other financial professional.

Sunday, December 29, 2019

Top 10 Dividend Champions: Price-to-Earnings

Top 10 Dividend Champions by Price-to-Earnings
Dividend Champions: Price-to-Earnings

2020 is on our doorstep; a new year with new opportunities.  It’s time to consider how to put money to work going forward.  Thus far we’ve explored possibilities by segmenting the Top 10 Dividend Champions according to the following value investing characteristics:

These factors fall within the framework of Benjamin Graham’s Value Investing philosophy, the tenets of which are outlined in his book Security Analysis and made famous by his student, Warren Buffett.

In line with Ben's Value Investing philosophy I’ve pulled the Top 10 Dividend Champions by lowest Price-to-Earnings (P/E) ratio as of December 2, 2019.  These ratios are based on the trailing twelve months (TTM) earnings for the firms shown.

Dividend Champion
P/E (TTM)
NACCO Industries
7.45
Nucor Corp.
9.59
Old Republic International
10.07
Franklin Resources
11.70
Enterprise Bancorp Inc.
11.77
Tanger Factory Outlet Centers
12.08
First Financial Corp.
12.12
Community Trust Banc.
12.41
Albemarle Corp.
12.60
National Fuel Gas
12.83

As a Dividend Farmer I prefer metrics involving facts versus guesses.  Investors using forward projections or earnings forecasts are comparing a given price (fact) with forecasts (guesses) about future performance.  Comparing factual performance (TTM) to actual price strikes me as a better approach because it reduces risk inherent in guessing.

From a value standpoint, paying for a dollar of earnings with a minimum number of dollars makes sense.  Other variables being equal, the time to recover the investment (payback period) is shorter with a low P/E.  Paying a smaller multiple of earnings for the privilege of ownership is desirable as long as other value factors are also appropriate.

With this said, the usual caveat is in place.  Don’t pour money into an investment because it appeared in a Top 10 list.  Conduct your due diligence.  Keep learning.  Make yourself a better, more knowledgeable investor.  Success is likely to follow.

Thoughts presented are those of the author, who is not a financial professional. Perspectives are not investment advice, but offered for the purpose of discussion and information. For specific investment advice or assistance, please contact a registered investment advisor, licensed broker, or other financial professional.
Thursday, December 26, 2019

Top 10 Dividend Champions: Price-to-Book


I consider several factors when selecting an investment for the Dividend Farm. It’s not just a function of building a Top 10 list and grabbing something from it. Dividend Yield affects my portfolio’s cash stream so it’s one of many variables I review. Sector or industry is important for diversification and risk mitigation. Dividend Growth Rate is a factor I consider, but it doesn’t carry as much weight as others.

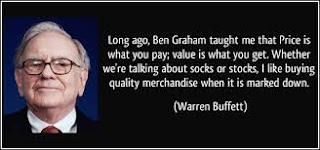
One variable I pay attention to is the Price-to-Book (P/B) ratio. If price is what you pay and value is what you get, how is value determined? 

Warrent Buffett Quote on Stock Value

Finding the book value of a company is one way to go about it.  Book value is a firm’s total assets less its intangible assets and liabilities per Investopedia. Dividing this figure by the number of shares outstanding results in book value per share. Comparing book value per share to the current price per share of the stock results in the Price-to-Book ratio indicating to me how much value I may receive for the money paid out. 

Am I paying more or less per share for a company than I might receive if it were liquidated and the net proceeds distributed?  I’ll hesitate to buy a stock if the P/B is in excess of 2:1 in most cases. I don’t like to pay more than $2 for every $1 I receive in value unless there are other favorable factors that can mitigate the risk associated with a high P/B ratio.

Below are the Top 10 Dividend Champions based on the Price-to-Book ratio as of December 2, 2019.  If you’re interested in any of these firms you can find updated P/B figures through your broker or in many cases via Yahoo! Finance.

Dividend Champion
P/B
Telephone & Data Sys.
0.59
People's United Financial
0.94
Universal Corp.
1.01
First Financial Corp.
1.04
Helmerich & Payne Inc.
1.07
United Bankshares Inc.
1.15
NACCO Industries
1.16
Old Republic International
1.17
Weyco Group Inc.
1.17
Chubb Limited
1.26

Do not select a stock based on the P/B value of a firm alone any more than picking a stock based solely on one of the other Top 10 lists.  As discussed above, many factors should be included in your analysis to mitigate risk and ensure you’re investing rather than speculating.  This is why it’s important to keep learning.  If you do that while compounding your dividends you can expect your investing savvy, portfolio size, and dividend cash flow to flourish.

Thoughts presented are those of the author, who is not a financial professional. Perspectives are not investment advice, but offered for the purpose of discussion and information. For specific investment advice or assistance, please contact a registered investment advisor, licensed broker, or other financial professional.


Friday, December 20, 2019

Top 10 Dividend Champions: 10-year Dividend Growth Rate


The two previous posts highlighted Top 10 Dividend Champions by Sector and Yield. Below you’ll find the Top 10 Dividend Champions based on their 10-Year Dividend Growth Rate (DGR).

Dividend Champions are firms that have increased their dividend payments annually for at least 25 years. Those in the table below have generated the largest percentage rate of growth in their dividend payments over the past 10 years. Due to ties the list includes 12 firms rather than 10. Dividend Farmers might consider it a Christmas bonus. There’s one each for the 12 Days of Christmas.

Champion
10-Year DGR %
Helmerich & Payne Inc.
31.0
Ross Stores Inc.
25.2
A.O. Smith Corp.
19.9
Stryker Corp.
19.0
Roper Technologies Inc.
19.0
Lowe’s Companies
18.4
Jack Henry & Associates
17.3
Cintas Corp.
16.1
Target Corp.
15.4
Computer Services Inc.
15.0
Hormel Foods Corp.
15.0
Walgreens Boots Alliance Inc.
15.0

You could view the table above as an initial screen for your DIY investment research and analysis. The Dividend Farming Company Scorecards are summaries I develop while exploring possible investments for The Farm. I compare several of a firm’s business metrics against defined benchmarks and those of alternative investments. That way I get a feel for a firm’s performance against a standard as well as its performance relative to other firms I’m considering.

The caveat about simply picking from a Top 10 list still applies. Good investors are always learning. Start with a screen like the one above and dig in. Find out about a firm’s performance across established financial metrics, industry position, and dividend history. Read about Benjamin Graham’s or Warren Buffett’s work to find out how master Value Investors selected stock. Above all, keep learning. You’ll become a savvy investor before you know it. You’ll see remarkable progress in your Dividend Farming harvest and a big smile on your future self.

Thoughts presented are those of the author, who is not a financial professional. Perspectives are not investment advice, but offered for the purpose of discussion and information. For specific investment advice or assistance, please contact a registered investment advisor, licensed broker, or other financial professional.    

Friday, December 13, 2019

Top 10 Dividend Champions by Yield


There are 138 Dividend Champions growing their dividends annually for 25 or more years. The last post outlined the Top 10 Dividend Champions by sector. Below are the Top 10 Champions based on dividend yield as of December 2, 2019, drawn from DRIPinvesting.org.

Dividend Champion
Dividend Yield (%)
Years Growing Dividends
Tanger Factory Outlet Centers
9.33
26
Helmerich & Payne Inc.
7.18
46
Altria Group Inc.
6.76
50
Meredith Corp.
6.56
26
Universal Corp.
5.82
48
AT&T Inc.
5.46
35
Mercury General Corp.
5.14
33
Exxon Mobil Corp.
5.11
37
Urstadt Biddle Properties
4.51
25
People’s United Financial
4.30
27

Averaging more than 35 years of dividend growth and a mean current yield of 6.02%, these Champions have produced nice cash flow for investors. The inflation rate in October, noted in an earlier Tweet, was below 2% in which case these dividend growers are comfortably ahead of the curve. Given the 1-, 3-, and 5-year average dividend growth rates of 5.5%, 4.3%, and 5.8% respectively, this group may continue outpacing inflation for some time.

Whether a new or established Dividend Farmer, the Top 10 Dividend Champions by yield is a nice place to begin your exploration and analysis before making your next investment decision. Remember, there is more to investing than simply picking from the Top 10 in any category. However, we must all begin our DIY investment efforts somewhere, why not start with Dividend Champion sector or yield?

Thoughts presented are those of the author, who is not a financial professional. Perspectives are not investment advice, but offered for the purpose of discussion and information. For specific investment advice or assistance, please contact a registered investment advisor, licensed broker, or other financial professional.

Friday, December 6, 2019

Top 10 Dividend Champion Sectors


Thanksgiving is behind us. Christmas is just ahead with the new year following closely. There are many things for which to be thankful, and I am. As a Dividend Farmer, I appreciate the investment opportunities and rewards provided by dividend companies with long histories of payments and dividend growth.

The year is drawing to a close so I thought I’d post the Top 10 Dividend Champions by metric across a variety of benchmarks. The first post starts with the Top 10 Sectors for Dividend Champions based on the number of Champions within each. Data is gleaned from DRIPinvesting.org which is a great resource for dividend growth investors. I recommend bookmarking it for future reference and analysis. This is, after all, DIY investing.

Sector
Dividend Champions
Average Years
Growing Dividends
Financials
35
33.4
Industrials
27
40.6
Consumer Staples
17
48.5
Utilities
15
42.8
Materials
12
38.4
Consumer Discretionary
8
46.8
Real Estate
7
31.1
Health Care
5
40.0
Energy
4
37.3
Information Technology
4
37.0

There are 138 Dividend Champions in total and 134 in the Top 10. Financials and Industrials account for just over 46% of the Top 10 shown above. It’s possible to overweight your portfolio with those two sectors if you’re not careful. Be aware of portfolio balance and diversity as you make your selections. Keeping an eye on Dividend Contenders as well as Champions is prudent to ensure you’re avoiding excess portfolio concentration and mitigating investment risk.

Although firms achieve Dividend Champion status once they’ve increased their dividend payments for 25 consecutive years, you’ll see there isn’t a sector averaging fewer years than 30 in the list. While past performance isn’t indicative of future results, it’s hard to argue with successful longevity. Firms producing long-term dividend growth warrant additional consideration in my investment decision making. Should they do the same for you?

The thoughts expressed here are those of the author, who is not a financial professional.  Opinions should not be considered investment advice.  They are presented for discussion and information purposes only.  For specific investment advice or assistance, please contact a registered investment advisor, licensed broker, or other financial professional.