Showing posts with label Charts. Show all posts

Tuesday, November 20, 2018

Portfolio: November 2018


The November Dividend Farmer 
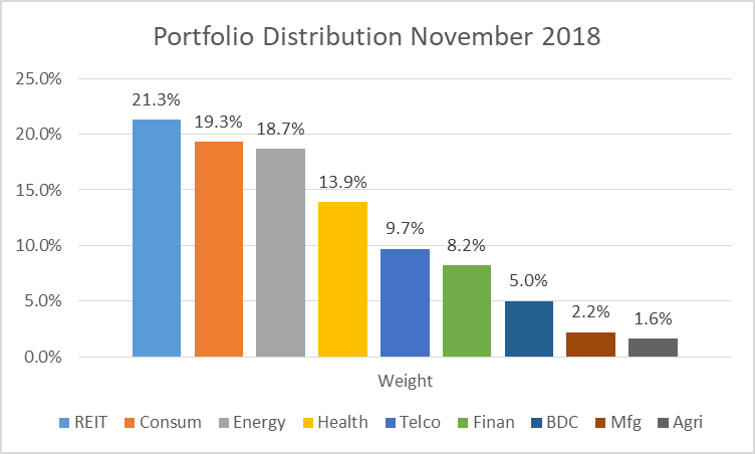
update saw a shift in portfolio weight relative to October.  Changes to weights at the bottom end of the basket were attributable to the addition of 100 shares of a telco.  Conversely, changes to weighted position at the top end were due mostly to REIT holdings all paying dividends, automatically reinvested, during the month.

November dividend income streamIn monitoring news articles and blogs no issues were found to be overly concerning regarding my holdings.  Once again, I’m not checking ticker symbols on a regular basis since my focus is on building the dividend income stream rather than market value.  Consequently, I try to focus on substantive issues adversely affecting the abilities of the investments to generate cash and didn’t find any in headline.  

The yield relative to current price bumped up from 3.82% in October to 3.84% in November due to the addition of the telco stock with an individual yield sufficiently high that it moved the portfolio yield ever so slightly.  All dividends are automatically reinvested with no transactions fees.  Unweighted average yield on cost is about 4.6%; nearly 1% higher than the current yield on price of 3.84%.

The average monthly dividend from this basket has now surpassed $1,100 – by a few bucks.  That doesn’t pay all the bills, but it is nice supplemental income if needed.  The trailing 1-year CAGR ballooned from 10.6% to 12.6%.  In looking at past history, jumps like these appear to coincide with dividend increases announced by multiple holdings in a single month.  Each month accelerates the income stream growth through the power of compounding.  The Compound Growth post offers more detail about the power of compounding your dividends through automatic reinvestment.

The thoughts and opinions expressed here are those of the author, who is not a financial professional.  Opinions expressed here should not be considered investment advice.  They are presented for discussion and entertainment purposes only.  For specific investment advice or assistance, please contact a registered investment advisor, licensed broker, or other financial professional.


Monday, October 29, 2018

Portfolio: October 2018


It’s time for the monthly update on my crop’s progress which is important as a Dividend Farmer.  Since the September update, there have been no major events adversely affecting my current holdings.

Although I monitor news articles and blogs for activity that might be unfavorable to my basket of stock, I’m not checking ticker prices on a daily basis.  Doing so invites a level of consternation I don’t need.  Instead, each investment is reviewed monthly to update dividend increases, price changes, and increases in stock quantities due to reinvested dividends paid during the month.

Not many changes relative to last month and no additions to principle.  However, due to dividend reinvestments in some segments, but not others, the percentages across segments have shifted slightly.  For instance, REITs were my top holding last month, but slid into second position in October.  Telco and Finance swapped rank order this month as well.  

Dividend Portfolio - October

The yield relative to current price dipped from 3.86% in September to 3.82% in October due to stock price increases across various holdings.  All dividends are automatically reinvested with no transactions fees.  Unweighted average yield on cost is approaching 4.6%; nearly 1% higher than yield on price.

The average monthly dividend from this basket is approaching $1,100.  That won’t pay all the bills, but it’ll put a nice dent in them if needed.  With a trailing 1-year CAGR of 10.6%, the long-term dividend farming strategy embarked upon 8 years ago is approaching the point of critical mass.  If you check out the Compound Growth post you’ll gain a sense of what I mean.


The thoughts and opinions expressed here are those of the author, who is not a financial professional.  Opinions expressed here should not be considered investment advice.  They are presented for discussion and entertainment purposes only.  For specific investment advice or assistance, please contact a registered investment advisor, licensed broker, or other financial professional. 


Portfolio: September 2018


Tracking my crop’s progress on a monthly basis is an important part of being a Dividend Farmer.  Although I casually monitor news articles and blogs for major events that may affect my investments one way or another, I’m not checking ticker prices on a daily basis.  Instead, each investment is reviewed once a month to record dividend increases, prices changes, and increases in stock quantities due to reinvested dividend paid during the month.

With that in mind, below is the September snapshot of a portion of my portfolio.  I segmented the group by industry and inserted a simple chart to demonstrate how I’ve allocated my dividend selections.

Every stock within each category is a dividend payer.  With the exception of the BDC segment, each category contains two to four different holdings.

Dividend Portfolio - September

This basket of stocks has a current dividend yield, relative to current price, of 3.86%.  All dividends are automatically reinvested with no transactions fees.  Because I’ve held most of these investments for several years, the yield on cost (initial purchase price) is actually .3% to 1.6% greater than the yield on price.  The higher yield on cost results from dividend increases relative to the initial purchase price which remains fixed. 

The total dividends from this basket is tracking to an annual run-rate north of $12,000.  It took several years to get here, but now the dividend returns are outstripping anything I can contribute to my 401K including a company match.  For instance, using $12,000, a 3% contribution, and a 3% company match, my salary would have to be over $200,000 a year to have a similar amount of money injected into my portfolio.  I’ll never command that kind of income.  Ever.  With a long-term dividend investment strategy leveraging the effects of compounding, I don’t have to.  Neither do you.  You just need to get started with the 4Things a Dividend Farmer Needs and work from there.  Food for thought…


The thoughts and opinions expressed here are those of the author, who is not a financial professional.  Opinions expressed here should not be considered investment advice.  They are presented for discussion and entertainment purposes only.  For specific investment advice or assistance, please contact a registered investment advisor, licensed broker, or other financial professional. 


Sunday, October 28, 2018

Compound Growth


Einstein quote on the power of compound interest.
Wisdom!
Growth is good.  Compound growth is better.  A related post outlines the difference between average annual growth and compound annual growth.  In this piece, I wanted to explore the benefits of compound growth in more depth.

One important characteristic of compound growth investors often find difficult to wrap their heads around is that compounding isn’t a straight line path to a wonderful stream of cash.  The greatest effects of compounding don’t happen right away, but at some point in the future.  The growth rate of a compounding investment accelerates over time producing a curvilinear path rather than a straight line.  This curve appears somewhat exponential, but isn’t exactly. 

While this type of curve produces solid results, it requires patience to stay the course until reaching the inflection point on the growth curve; the point at which compounding really begins to take off.  Unfortunately, many investors don’t stick with it until that acceleration point is reached, bailing out before harvesting the true gains they might have otherwise.

Here is an example of what I mean.

Dividend Growth Compounding


In this example, an investor started with $1,000.  She put her money into a dividend stock having a distinguished history paying 8% annually, letting dividends automatically reinvest each year.

You’ll notice that at the end of Year 1 she received $80 in dividends so we’ll call that 1x.  In Year 10 she received $160 dollars which was twice what she received in Year 1 so we’ll call that point 2x.  In Year 15 she received $234 which is nearly three times her Year 1 dividends in which case we’ll call that data point 3x.  Year 19 saw our investor receive $320 which is four times her Year 1 dividends so we’ll refer to that point as 4x. 

Since you get the drift, I won’t use more words, but instead post a chart.

Dividend Multiples
Years
1x
1
2x
9
3x
15
4x
19
5x
22
6x
24
7x
26
8x
28
9x
30

You’ll notice it took our investor 8 years to double her year 1 dividends, 6 more years to triple those divs, 4 additional years to quadruple them, and three years to reach 5x.  After that, she added another multiple to her original payment every 2 years. 

In the first 15 years her dividend stream compounded to triple her year 1 total.  In the second 15 year period, she saw the effects of compounding take off with her annual dividend multiple reaching 9 times hear year 1 dividend payment. 

This is what I mean about the powerful effect of compound growth not occurring out of the gate but somewhere down the track.  Consequently, it’s important for investors to stay the course.

It’s important to begin investing early and letting compound growth work for you for this reason.  If you’re a young investor or you have small children who’ll need college money in 15 to 20 years, you can do yourself a favor by putting money away early, even if it’s not a large sum.  Compounding can take a small sum and turn it into something big in the end.

By the way, if you’re wondering what the underlying principle was at various points along the way, below is a chart in which I’ve added that data.  Notice that during the 30-year period her final total is more than 10 times her original value.

Dividend Multiples
Years
Principle
1x
1
 $          1,080
2x
9
 $          1,999
3x
15
 $          3,172
4x
19
 $          4,315
5x
22
 $          5,436
6x
24
 $          6,341
7x
26
 $          7,396
8x
28
 $          8,627
9x
30
 $        10,062

Having said all that it’s true that not all dividend stocks pay 8%, nor can you be guaranteed they’ll pay out at that rate 3 decades into the future.  It’s also true that inflation will eat into the figures above.  Although nothing in life is guaranteed, some things are more likely to occur than others.  Dividend streams from solid, blue chip dividend companies are about as reliable as you’ll find in the investing world.  If they remain consistent and you are patient, the math of compounding will take care of itself and you.

The thoughts and opinions expressed here are those of the author, who is not a financial professional.  Opinions expressed here should not be considered investment advice.  They are presented for discussion and entertainment purposes only.  For specific investment advice or assistance, please contact a registered investment advisor, licensed broker, or other financial professional.


Friday, October 26, 2018

Powerful Investment Growth with Compounding


Have you dreamed of making money without doing anything?  You know, just laying around the beach with an umbrella drink in hand, knowing money is falling into your bank account as you lounge in a cabana overlooking the surf?  What if the money pouring into your bank account next week was much greater than the money going in today without so much as ordering another umbrella drink?

Ah, the life!

Ok, back to reality.  While it may not be as spectacular or compelling as the vignette above, Dividend Farming does function much the same way thanks to compounding, albeit over a longer period.  Check out the charts below to see what I mean.

The first chart shows what happens when you start with $10,000 invested in year zero at a rate of 7%.  Your money is compounded annually with a 30-year horizon.  Yes, it’s longer than a week, but stick with me.

Graph of 7% Compound Growth Curve
7% Compound Growth Curve

As you can see, your nest egg has gone from $10,000 to more than $75,000 during that period.  It’s grown more than 7.5 times and you did nothing; just watched it grow. 

The next 2 charts provide insight into the power of compound growth by measuring the slope or rate of growth during 10-year intervals along your investment curve.

Graph of 7% compound growth curve by 10 year segments.

In the chart above, I stripped out the investment figures for the years between 0, 10, 20, and 30 leaving a clean, straight growth line for each period.  With a simplified curve, I calculated the slope of each 10-year interval as shown in the chart below.  The change in investment value between any two points was divided by 1,000 to reduce their scale making it easier to see and understand the differences in slope.

Bar Chart Showing Slope of Investment Curve Compounded at 7%

During the first 10-year period, the slope of investment growth was 1.0.  During the 2nd 10-year period, the slope of the line grew to 1.9, nearly doubling.  In the 3rd 10-year period, the slope of the investment growth nearly doubled again, reaching 3.7.

Here’s the key takeaway.  The power of compound growth, like that available with strong, consistent dividend paying stocks, increases over time.  The longer your investment horizon, the greater the strength you can harness. 

Exercising this power requires the patience of a Dividend Farmer.  It doesn’t mean you’ll be sipping a cool drink on a pristine beach today or tomorrow while Benjamins pour into your bank account.  However, the power of compound growth available with dividends automatically reinvested means living that beach life down the road is possible.

The thoughts and opinions expressed here are those of the author, who is not a financial professional, and therefore should not be considered as investment advice.  This information is presented for education and entertainment purposes only.  For specific investment advice or assistance, please contact a registered investment advisor, licensed broker, or other financial professional.