Tracking my crop’s progress on a monthly basis is an
important part of being a Dividend Farmer.
Although I casually monitor news articles and blogs for major events
that may affect my investments one way or another, I’m not checking ticker
prices on a daily basis. Instead, each
investment is reviewed once a month to record dividend increases, prices
changes, and increases in stock quantities due to reinvested dividend paid
during the month.
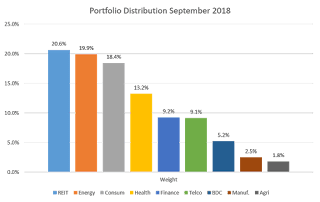
With that in mind, below is the September snapshot of a
portion of my portfolio. I segmented the
group by industry and inserted a simple chart to demonstrate how I’ve allocated
my dividend selections.
Every stock within each category is a dividend payer. With the exception of the BDC segment, each
category contains two to four different holdings.
This basket of stocks has a current dividend yield, relative
to current price, of 3.86%. All
dividends are automatically reinvested with no transactions fees. Because I’ve held most of these investments
for several years, the yield on cost (initial purchase price) is actually .3%
to 1.6% greater than the yield on price.
The higher yield on cost results from dividend increases relative to the
initial purchase price which remains fixed.
The total dividends from this basket is tracking to an
annual run-rate north of $12,000. It took
several years to get here, but now the dividend returns are outstripping
anything I can contribute to my 401K including a company match. For instance, using $12,000, a 3%
contribution, and a 3% company match, my salary would have to be over $200,000
a year to have a similar amount of money injected into my portfolio. I’ll never command that kind of income. Ever.
With a long-term dividend investment strategy leveraging the effects of compounding,
I don’t have to. Neither do you. You just need to get started with the 4Things a Dividend Farmer Needs and work from there. Food for thought…

No comments:
Post a Comment