Saturday, August 31, 2019

Div Tip #19: No fear.

Image of Dividend Tip Jar.
Dividend Tip Jar

Caution, yes.  Fear, no.  Many investors hesitate to pursue their own best investing interests because they think they’ll screw things up.  As Winston Churchill aptly put it:  “Success isn’t final, failure is not fatal: it is the courage to continue that counts.”  This is true of DIY investing and Dividend Farming.

Will mistakes be made?  Yes.  Will they sink your portfolio?  Not if you manage your investing risk.  If you start early and learn as much as you can along the way, the less likely you’ll do irreversible damage.  Mistakes will be small, lessons large, and the time available to recover great.  With time and wisdom on your side you’ll go right more often than wrong.  That’s the long-term key to successful Dividend Farming.

1 John 4:18 says it well:  Perfect love drives out fear.  If you love your family, enjoy the investing process, look forward to your future, and move forward with a positive attitude, you’ll do better than you think.  Be prepared.  Minimize your risks.  Be prudent and have no fear.

Tuesday, August 27, 2019

Hard to farm dividends under water.


“Neither a borrower nor a lender be.”  Shakespeare wasn’t just a literary genius.  He was imparting financial savvy to the masses.

Unfortunately, many people missed The Bard as well as the financial intelligence available today.  They rack up debt like our government, which explains a lot.  It seems the debt load may be due to ignorance.

Image of Proverbs 22:7 - the borrower is slave to the lender.
Ancient advice that's sound today.

As a Dividend Farmer, it’s important to understand debt because it’s hard to farm dividends under water financially.  Every dollar of debt incurred results in additional dollars stolen from your dividend operation because you have to pay back the dollar borrowed plus the interest accrued. 

The sad fact of our immediate gratification society is that people don’t think or know how much they’ll actually spend on debt when they make a credit card purchase.  Again, much like our government.

One way to address this is to learn about debt.  Practically speaking, it means understanding how much the debt will cost you during the period you pay it.  More importantly, how much of the cash pool won’t be available for seeding a Dividend Farm. 

With knowledge, it’s easier to make informed opportunity-cost decisions.  If the true cost of a purchase (original price + interest paid) is known, a reasonably comparison between that cost and the value of the item purchased can be made.  It’s also possible to compare the cost of debt to the investment money lost due to debt payments.

How does anyone, other than the lender, know how big the interest penalty will be so a comparison can be made?  A couple methods follow using an average credit card interest rate.

Wallet Hub’s Credit Landscape Report from January 2019 indicated the average interest rate on a secured credit card was 18.81% so we’ll start there.

Step 1:  Divide the interest rate (18.81% in this case) by the number of days in a year (365 for earthlings) to get the daily rate.  .1881 / 365 = .00051534.

Step 2:  Multiply the daily rate from above by the average daily balance from your credit card statement.  For example, Discover Card claims the average American household carried $16,061 in credit card debt in 2016.  Using that figure the equation would look like this:  .00051534 x $16,061 = $8.27.

Step 3:  Multiply the daily rate by the number of days in the billing period which is typically 30.  This equation would be:  $8.27 x 30 = $248.30. 

In this example, nearly $250 in interest is paid before touching the principle.  Shelling out $250 a month to cover 18.81% interest is a lot of money that could otherwise be put to use on a Dividend Farm.

Another way to estimate the price of interest is to use an amortization calculator like any of the free versions found on line.  An example Excel version is shown below.  Plugging the average balance from your credit card into the calculator along with the interest rate from the card and using a 5 year loan period (as requested by the National Foundation for Credit Counseling) results in an interest payment of $251.76 for the period.  This figure is close to the $248.30 payment calculated previously.

Image of free amortization table in Excel.
Free Amortization Table in Excel
In either case, you’ll sink over $3,000 a year in interest into a credit card company instead of putting that money to work on your Dividend Farm.  It doesn’t take many years at that rate to substantially, and negatively, effect a retirement portfolio.

It must be noted that credit card issuers may use different calculations.  For instance, they might calculate repayment on a 10 year basis rather than 5.  The interest paid during a 10 year payback would be $19,677 against the average debt of $16,061.  Conversely, a 5 year repayment would require paying “only” $8,836 in interest on the original $16,061 in debt.

Who wants to spend 50% to 100%+ the sticker price for anything?  Think about the Dividend Farming possibilities available when that much money ($25,000 or more in the above example) is available rather than paying it all to Discover, American Express, Visa, or MasterCard.

Image of Dave Ramsey quote about borrowing.
Dave Ramsey's Spot-on Advice
Understanding debt, managing it, or better still, avoiding it, can work wonders on your financial future.  If controlling small costs increases your dividend cash flow stream, think what eliminating big costs like excessive credit card debt can do?

Monday, August 26, 2019

Div Tip #18: Know your metrics.

Image of Dividend Tip Jar.
Dividend Tip Jar

Once you’ve worked through your initial screens (Div Tip #17) you’ll need to dig further into your investment targets to make selections.  Dividend Farmers cue off Ben Graham when exploring the fundamentals of a target firm.

Length of dividend history, market cap size, position relative to competitors, price-to-book value, average earnings, and debt-to-equity are among the metrics of choice when assessing a firm’s potential earnings strength and stability relative to the risk it bears.  Investing, not speculating, is the name of the game.

Being unfamiliar with Ben’s value benchmarks requires following Div Tip #9 and learning about them.  Additional resources and links to resources to help you master the metrics of Dividend Farming are readily available.  Dividend Farming focuses on the data and analysis rather than the emotion.  Don’t relegate your investment decisions to emotion.  Know your metrics.  Reduce your risk.  Improve the odds of success.  Sleep soundly as you farm your way to a better future.  

Sunday, August 25, 2019

Div Tip #17: Focus on quality.

Image of dividend tip jar.
Dividend Tips
How does an investor select investments among the thousands of publicly traded companies from which to choose?   For most of us it’s a function of screening or filtering the massive pool of options down to something manageable.  Investors screen by past or expected growth rate, industry, geography, dividends, and more.  They may have multiple levels of screens to further narrow the field for selection. 

Dividend Farmers naturally start with dividend paying stocks, but not any dividend payer.  Stocks that regularly grow their dividend payments can be found under Dividend Champions, Contenders, and Challengers.  Dividend Aristocrats also lists dividend growers increasing payments for 25+ years.

In either case, companies with extended histories of growing their dividend payments exhibit investment quality as a function of their ability to throw off increasing amounts of cash.  Finding similar signs of quality among non-dividend payers requires more effort.  It’s like looking for a diamond among gem stones vs doing so among road apples.  Given the choice of starting points and the level of work involved in each to succeed, which would you rather?  If you start your search with quality, you increase the odds you’ll invest in quality companies.  Focus on quality.

Saturday, August 24, 2019

3-Year Dividend Crop Growth


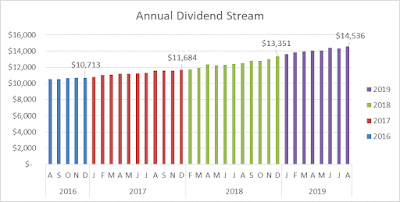
The chart shows the growth of the Dividend Farm’s crop from August 1, 2016, through August 1, 2019.

3 year dividend stream growth chart

For the 3-year period:
  • Compound Annual Growth Rate (CAGR):                   11.3%
  • Average Annual Growth:                                               11.9%
  • Total Growth:                                                                 35.8%

Growth from 2016 through the first half of 2018 was exclusively due to increases in company dividend payments, dividend reinvestment, and the power of compounding.

Albert Einstein quote about the power of compound interest.

Infusions of capital were made in the fall of 2018 and spring of 2019.  These additions helped increase the slope of the trend line.

Extending this trend to an age where I can take full Social Security payments means the dividend stream may double – more than twice – to over $58,000.  Although not an enormous amount, coupling with Social Security, budget discipline, and little or no debt results in contented retirement.

It’s not flashy, but it’s working.  Dividend Farming is financial pragmatism – doing what works – even when considered slow or unsophisticated.  If the end result is a good night’s sleep, solid “wake up” money, and limited risk along the way, who cares about flash?


Wednesday, August 21, 2019

Div Tip #16: Ride the slow growth.

Dividend Tip Jar
Dividend Tip Jar

Dividend growth stocks (DGS) are deceptively powerful.  They’re the workhorse in a Dividend Farmer’s portfolio.  Realizing the potential of a dividend grower takes time, but the juice is worth the squeeze.

Assume a dividend stock pays 4% and has maintained a steady 2% growth rate for an extended period; similar to many Dividend Champions.  If that stock is held for the long run the dividend payout at 15 years will be nearly 35% higher than it was at purchase.  After 20 years it will be almost 49% higher and at 30 years the dividend payout will be more than 81% higher than it was when the stock was first acquired.  An investor has to hold onto the stock, remain patient, and monitor progress.

Investors may not be guaranteed a sustained 30-year run of dividend growth – even at 2% annually.  However, consider the value appreciation of a given stock may be no better over that period; and could be worse with no dividend payment to cushion inevitable downturns. 

Choosing between a lengthy record of dividend growth and the financial power it conveys vs the volatility of alternatives is easy for a Dividend Farmer.  It pays to ride the slow growth nearly every time.    

Thursday, August 15, 2019

How to grow the rate of a dividend stream by 1% (or more)


The previous post noted that 1% is bigger than you think relative to your dividend stream and the period of time required for it to double in size.  The concept involves compound annual growth rates (CAGR) and the Rule of 72.

I finished by saying I’d share ways to increase the compound growth rate of a div stream by at least 1%.  Here goes…

Transactions Costs 

There are two items involved here.  One is the actual cost of buying a stock.  The other is a function of investment size and frequency.  I’ll take cost first.

Cost:  Brokerages have charged $4.95 to $40 per trade over the years.  Given $500 to invest, spending $4.95 of it to make the trade puts roughly $495 to work in the portfolio.  Conversely, spending $40 on a trade gets $460 into a portfolio putting it $35 (7%) behind.  And it’s not even out of the investing gate.

 
Cut Your Transactions Costs
Another way to look at it is to assume a 10% dividend (makes the math easy) on the $460 portfolio which yields $46.00.  However, reducing transactions costs from $40 to $20 through a discount broker, means $480 in the portfolio and $48.00 in dividends at the end of the year.  The $2 dollar increase from $46 to $48 represents a 4% increase in my growth rate.  This doesn’t sound like much, but if you’ll recall the last post, it can make a heck of a difference.


Investment size and frequency:  Breaking an investment amount into multiple smaller increments vs pulling the trigger on one large stock purchase can make a difference as well.  Assume a $500 investment figure.  If it’s split across 5 purchases of $100 each with a brokerage fee of $4.95 per trade it means spending $24.75 on those stock buys. 

However, saving your powder and investing all $500 in a single trade, means spending $4.95 netting an additional $19.80 going to work in a portfolio rather than a broker’s pocket.  That $19.80 provides a 4.9% head start that widens further with time.  Trading often in small amounts puts a sneaky big dent in the compound growth rate.

It’s good to be aware of trade-offs on this point.  Spreading amounts across multiple smaller purchases is how some investors prefer to diversify.  Diversification is helpful, but the law of diminishing returns on risk reduction kicks in quickly.  Weigh diversification needs against transaction cost reduction to determine which route is a better fit.

Portfolio Yield 

As with transactions costs there are a couple ways to approach this.
Portfolio Yield Sign
Portfolio Yield
Whole portfolio yield:  This is easy to explain, but difficult to pull off.  If the stocks in a portfolio are each paying 4%, trading them all in for similar stocks paying 5% results in a 1% increase in the rate at which the dividend stream compounds.  This is easy but assumes no transactions costs or capital gains taxes are involved.  Beyond that drag, finding a basket of 5 percenters meeting the investing criteria of the 4% stocks they are replacing is challenging.  Consequently, the next method is more realistic.

Portfolio mix and weighted average:  This method takes analysis and is helped by the use of Excel.  The following example is an over simplification, but it demonstrates the point.  Let’s assume a portfolio of $1000 paying 4% produces a dividend stream of $40.  Split $50 (5%) from that $1,000 and invest it in a stock paying 8%, which is possible.  The $950 investment paying 4% yields $38 and the $50 investment paying 8% yields $4 for a total of $42.  The additional $2 is a 5% increase over $40 otherwise available.

Please note some investors consider allocating dollars to high yield stocks a way of introducing additional of risk – and rightly so.  However, a small amount of risk may be acceptable for investors as long as the additional risk is applied to a small segment of a portfolio that’s big enough to move the weighted average and increase the dividend stream by 1% or more.  This is one of those times when knowing your risk tolerance is important.  So is understanding the concept of opportunity – cost which is required to weigh the added risk against the added growth.

Dividend growth stocks
Dividend Dollars Multiply

These are a favorite of value investors.  Buying offerings in this category, particularly those with long records of growth, means raising the dividend paid nearly every year just by holding the stock.  Here’s an example of what that can mean.
 
Two portfolios of $1,000.  Both pay a 4% dividend.  Portfolio A does not raise its dividend while Portfolio B does so in small increments, say 3%, each year.  “A” delivers $40 year after year assuming no reinvestment.  However, “B” delivers $40 the first year and $41.20 the second year assuming no compounding. 

As you may have guessed, portfolio B grows the dividend stream by 3% relative to portfolio A.  Imagine what this delta can do over many years as the investment portfolio grows?  Think about what happens if this growth compounds along the way because all dividends are reinvested?  Dividend growth is powerful.  It takes patience and persistence.  It’s worth it.

There are several methods Dividend Farmers can use to increase the CAGR of their dividend cash flow.  These options don’t require exceptional skill or the addition of great risk.  Better still, they can be stacked to compound the compounding.  Reducing transaction costs, purchasing dividend growth stocks, and mixing in a pinch of high yield stock with a long history of steady payments can add 1% or more to the growth rate of your dividend income stream.

Thoughts expressed here are those of the author, who is not a financial professional.  These opinions should not be considered investment advice.  They are presented for discussion and entertainment purposes.  For specific investment advice or assistance, please contact a registered investment advisor, licensed broker, or other financial professional.

Monday, August 12, 2019

1 Percent: It’s bigger than you thought.

1% is BIG image
1% is BIG

Div Tip #15 described how a 1% increase in the compound growth rate of a dividend cash stream reduced the time needed for that stream to double in size.  This post expands on that Div Tip.


The first column in the table below shows portfolios throwing off dividend streams with Compound Annual Growth Rates (CAGR) ranging from 4% to 20%.

Column two applies the Rule of 72 to highlight the number of years required for that dividend stream to double in size assuming the initial rate continues unabated. 

The first couple columns are well understood.  Columns three and four contain the important information.

CAGR
Years to Double
Years Doubling Time is Reduced
% Decrease in Doubling Years
4
18.0


5
14.4
3.6
20%
6
12.0
2.4
17%
7
10.3
1.7
14%
8
9.0
1.3
13%
9
8.0
1.0
11%
10
7.2
0.8
10%
11
6.5
0.7
9%
12
6.0
0.5
8%
13
5.5
0.5
8%
14
5.1
0.4
7%
15
4.8
0.3
7%
16
4.5
0.3
6%
17
4.2
0.3
6%
18
4.0
0.2
6%
19
3.8
0.2
5%
20
3.6
0.2
5%

The third column shows how many years are shaved off the time to double when growing the CAGR 1%.  For example, taking a dividend cash flow stream compounding at 4% and moving that compounding rate to 5% knocks 3.6 years off the time to double.  Those 3.6 years represent a 20% reduction in the time needed to double your initial dividend stream courtesy of a 1% increase in the rate at which the stream compounds.  A 20 to 1 payback.  Outstanding.
 
As noted in Div Tip #15, growing the compounding rate from 8% to 9% results in a more modest 11% reduction in the time needed to double a dividend income stream.  Of course, moving further down the chart demonstrates that the amount doubling time is reduced declines to point at which the time to double decreases only 5%.  However, a 5% reduction in doubling time for a 1% increase in CAGR is still solid.  Who wouldn’t pay $1 to get $5?

It’s easy to see why small things that improve the rate at which a dividend stream is compounding make a big difference and are important to a Dividend Farmer.  The next post highlights several ways to improve the CAGR of a dividend paying portfolio reducing the time to double that income stream.

Thoughts expressed here are those of the author, who is not a financial professional.  These opinions should not be considered investment advice.  They are presented for discussion and entertainment purposes.  For specific investment advice or assistance, please contact a registered investment advisor, licensed broker, or other financial professional.

Sunday, August 11, 2019

Top 5 Dividend Payers Going Ex-dividend: Week of 8.12.19


Here are the top 5 dividend paying firms, based on largest dividend payment, going ex-dividend this week.  Icahn Enterprises, Consolidated Edison (Champion), Amgen (Challenger), Simon Property Group (Contender), and Chevron (Champion).  They may be found on the DRIPinvesting.org web site; growing their dividend payments for nearly a decade or more.  Cash flow with a raise!

Monday:

Icahn Enterprises L.P.
Paying:  $2.00 per share
On:  September 18 

Tuesday:

Consolidated Edison Inc.
Paying: $0.74 per share
On: September 16
Dividend Champion:  Years Growing Divs - 45 

Wednesday:

Amgen Inc.
Paying: $1.45 per share
On: September 6
Dividend Challenger:  Years Growing Divs - 9 

Thursday:

Simon Property Group, Inc.
Paying: $2.10 per share
On: August 30
Dividend Contender:  Years Growing Divs - 10 

Friday:

Chevron Corporation
Paying: $1.19 per share
On: September 10
Dividend Champion:  Years Growing Divs - 32


Thoughts expressed here are those of the author, who is not a financial professional.  These opinions should not be considered investment advice.  They are presented for discussion and entertainment purposes.  For specific investment advice or assistance, please contact a registered investment advisor, licensed broker, or other financial professional.