Tuesday, November 20, 2018

Portfolio: November 2018


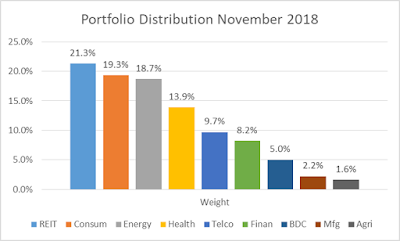
The November Dividend Farmer update saw a shift in portfolio weight relative to October.  Changes to weights at the bottom end of the basket were attributable to the addition of 100 shares of a telco.  Conversely, changes to weighted position at the top end were due mostly to REIT holdings all paying dividends, automatically reinvested, during the month.

November dividend income streamIn monitoring news articles and blogs no issues were found to be overly concerning regarding my holdings.  Once again, I’m not checking ticker symbols on a regular basis since my focus is on building the dividend income stream rather than market value.  Consequently, I try to focus on substantive issues adversely affecting the abilities of the investments to generate cash and didn’t find any in headline.  

The yield relative to current price bumped up from 3.82% in October to 3.84% in November due to the addition of the telco stock with an individual yield sufficiently high that it moved the portfolio yield ever so slightly.  All dividends are automatically reinvested with no transactions fees.  Unweighted average yield on cost is about 4.6%; nearly 1% higher than the current yield on price of 3.84%.

The average monthly dividend from this basket has now surpassed $1,100 – by a few bucks.  That doesn’t pay all the bills, but it is nice supplemental income if needed.  The trailing 1-year CAGR ballooned from 10.6% to 12.6%.  In looking at past history, jumps like these appear to coincide with dividend increases announced by multiple holdings in a single month.  Each month accelerates the income stream growth through the power of compounding.  The Compound Growth post offers more detail about the power of compounding your dividends through automatic reinvestment.

The thoughts and opinions expressed here are those of the author, who is not a financial professional.  Opinions expressed here should not be considered investment advice.  They are presented for discussion and entertainment purposes only.  For specific investment advice or assistance, please contact a registered investment advisor, licensed broker, or other financial professional.


Friday, November 16, 2018

Dollar-cost Averaging Powers Dividend Farming


Dollar-cost averaging is an integral part of DividendFarming.  It’s a powerful method of growing a great financial crop.  The best part; it’s simple and automatic.

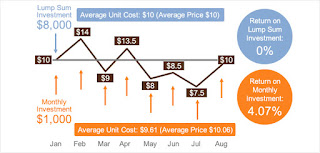
In a nutshell, dollar-cost averaging means contributing an amount of money to your investment portfolio to purchase stock on a monthly basis.  You could also do so quarterly, but monthly is advantageous due to the increased number of compounding periods.  The more the merrier, but I digress.  As an example, you might purchase $100 worth of stock each month and do so irrespective of whether the stock’s price has increased or decreased.

Dollar Cost Averaging Chart.
Courtesy of JP Morgan

With dollar-cost averaging you may purchase a few shares at high prices, but you are also likely to purchase more shares at lower prices.  The table below demonstrates the principle using the $100 example mentioned previously.

Month
Share Price
Shares Purchased
January
$25
4
February
$28
3.5
March
$27
3.7
April
$23
4.3
May
$20
5
June
$22
4.5
TOTAL

25

You will have purchased anywhere from 3.5 to 5 shares per month with your $100 investment as long as you were disciplined about putting money into your brokerage account and making the purchase. 

Brokerage Fees and Partial Shares

Realistically, if you were making the purchases with contributions to your account, the stock purchase figures would be lower because you would have paid a brokerage fee each time you made a purchase.  If a broker charged you $5 for each trade, you would be investing only $95 per month to buy stock.  Consequently, the quantity of stock you buy each month would be lower than shown. 

It should also be noted you can’t buy partial shares this way.  This means another portion of your $100 would be unavailable to use for purchases each month.  This money could be held in the account and used to supplement your purchase the following month, but you still miss the full effect of dollar-cost averaging.  The next table offers clarity.

Month
Share Price
Commission Fee
Funds Available
Shares Purchased
Balance
January
$25
$5
$95
3.0
$20
February
$28
$5
$95
3.0
$6
March
$27
$5
$95
3.0
$9
April
$23
$5
$95
4.0
$3
May
$20
$5
$95
4.0
$10
June
$22
$5
$95
4.0
$7
TOTAL


21
$56

In this example, which is more realistic, you would purchase only 21 shares during the same 6-month period versus the previous case.  You would contribute $30 to your broker for the privilege of making the purchases.  An additional $56 of your $600 in investment funds accumulated in the account because you can’t purchase partial shares. 

Based on the purchase prices shown, you would have to accumulate the leftover funds for about 3 months before you could use them to purchase an additional share of stock.  You effectively lost $86 ($30 + $56) or 14.3% of your investment to the broker or the opportunity-cost associated with not being fully invested each month.

Ok, if you lose a large chunk of your investment funds in the dollar-cost averaging example shown, how can that be beneficial to you as a dividend farmer?  When farming dividend stocks, the dividend payments can be accepted into your brokerage account as cash and reinvested in additional dividend stock.  Managing your dividends this way results in the kind of attrition highlighted in the second table.

DRIP Strength

However, if you have your dividend payments automatically reinvested in the companies paying them, you avoid the brokerage fees and you’re allowed to purchase partial shares.  When you receive $600 worth of dividends and reinvest them in a DRIP, you put the full $600 to work for you, compounding all the way, increasing your crop yield.  

This is the true power of dividend reinvestments.  Additionally, you’re assured of automatic contributions to your portfolio each month.  Efficient, disciplined investing maximizing your ability to grow a healthy dividend crop.  Who doesn’t like that?
   
The thoughts and opinions expressed here are those of the author, who is not a financial professional.  Opinions expressed here should not be considered investment advice.  They are presented for discussion and entertainment purposes only.  For specific investment advice or assistance, please contact a registered investment advisor, licensed broker, or other financial professional.

Sunday, November 11, 2018

4 Rules for Stock Investing from Benjamin Graham


Dividend investing (farming) is considered a form of defensive investing by the trading class.  It’s defensive because dividend stocks are generally less volatile than growth stocks, for instance.  This means div stocks typically won’t see huge value appreciation but shouldn’t experience large declines either.  And any decline they do experience can be partially offset by dividend distributions.  Hence defending against losses with limited potential.  Or so goes the theory.

Intelligent Investor book.
For the Dividend Farmer's Library
Intelligent Investing was characterized in the last post as being less about raw intelligence than persistent fortitude; the ability to stick with the process.  Although the view is rather philosophical, it’s not intuitively practical.  Fortunately, 114 pages into Graham’s work, he provides 4 specific and practical rules when selecting common stock for the Intelligent Investor’s portfolio.

Diversification:  Per Graham, diversification should be adequate, but not excessive.  This might mean a minimum of ten different issues and a maximum of thirty.  The Dividend Farmer’s post on investment diversification  covered the probability underlying this stratagem and proposed a portfolio of 20-30 well selected stocks, possibly less, to mitigate investment risk through diversified holdings.

Size:  Selected companies should be large, prominent, and conservatively financed.  Large, prominent firms carry the notion of substantial size or market capitalization of roughly $10 billion and occupy a leading position in their respective industry.  As for conservatively financed, Graham indicates such firms should have a book value per share that’s at least half its current market value.

Dividend Payments:  Each company should have a long record of continuous dividend payments; at least 10 consecutive years.  An earlier post on Dripinvesting.org offers visibility into how many companies are available that meet or easily exceed this guidance.

Price:  Graham suggests a limit on the price an investor is willing to pay for a stock investment that’s no more than 25 times its average earnings.  Since growth stocks frequently have price to earnings multiples well in excess of 25 times, this benchmark is a reasonable guide for staying within the bounds of defensive investments which suits this Dividend Farmer well.

What does this mean if you’re interested in Dividend Farming?  The diversification rule is well covered in a related post linked above. 

Size can be readily determined by using Yahoo Finance to investigate the firm in which you’re interested.  Plug the company name or ticker symbol, if you have it, into the search bar and the firm's profile page appears.  The Summary tab provides the firm’s market capitalization or size in the first line under the heading. 

Dividend payment history is located on the same Yahoo page under the Historical Data tab.  Click the Historical Prices drop-down menu and select Dividends Only.  What you’ll see is a string of dividend payments and payment dates.  This means you’ll have to scroll through the dividend payment dates and determine the length of history on your own. 

Alternatively, you can go to the previously referenced DRiP Investing.org and find the information in a handy Champions, Contenders, and Challengers (CCC) spread sheet.  Within that sheet the number of years of consecutive dividend payments is clearly provided.

As for the price, the same CCC spreadsheet offers up a 5-year Price to Earnings Growth figure.  Alternatively, you can find a Trailing Twelve Months (TTM) Price to Earnings figure on the same Yahoo Finance page Summary tab for your firm along with the Market Capitalization.  The TTM data will be 3 lines below the Market Cap figure.

With the two resources mentioned, DRiPInvesting.org and Yahoo Finance, you can do plenty of the research required to find good investment ground.  If you’re working through a large brokerage like Schwab, TD Ameritrade, Fidelity, or others, you likely have access to a host of similar tools to help you determine where you’ll plant your dividend investment seeds.  From there, keep on farming.

The thoughts and opinions expressed here are those of the author, who is not a financial professional.  Opinions expressed here should not be considered investment advice.  They are presented for discussion and entertainment purposes only.  For specific investment advice or assistance, please contact a registered investment advisor, licensed broker, or other financial professional.


Friday, November 2, 2018

Intelligent Investing: More character, less brain


Intelligent Investor book.
Patience.  Discipline.  Education
One of the books on my current reading list is The Intelligent Investor by Benjamin Graham.  If you don’t know who Benjamin Graham is, but are familiar with Warren Buffett, know this – Graham was Buffett’s financial teacher and mentor.  Graham is known as the father of value investing.

I read through The Intelligent Investor ten or twelve years ago.  It’s been on my shelf since then, occasionally referenced, but mostly collecting dust.  Because of Dividend Farmer, which discusses a form of value investing, I thought I’d wade through 536 pages of Graham’s work once more.

The tome serves up plenty of knowledge on the fundamentals of investing and foundational principals like margin of safety.  Although I’m keen to reexamine these topics, I’m also fascinated by Graham’s philosophical perspective.

For instance, Graham defines the term intelligent investor early on indicating that intelligence doesn’t mean possessing exceptional IQ or SAT scores.  Instead, intelligence is a function of patience, discipline, eagerness to learn, and the ability to think for yourself rather than following conventional wisdom.

4 Things a Dividend Farmer Needs discussed the requirement for patience and care in tending your dividend investments.  This diligence includes careful selection up front as well as monitoring and waiting patiently after the seeds have been planted in order to harvest your crop. 

The principal of buying and holding solid companies is a cornerstone in Graham’s value investment world.  The beauty of it is that finding, buying, and holding quality companies over the long run doesn’t require a Ph.D. or a degree in rocket science.  Dividend Farmer isn’t about piling it higher and deeper or employing orbital mechanics to get to an investment destination.


However, value investing through dividend farming requires a touch of persistence in discovering value and holding onto it in the face of advice from the trading class.  Remember, traders don’t get paid for investing so much as they get paid for you buying and selling.  This may be why traders on the floor of the New York Stock Exchange cheer at the closing bell regardless of whether the market went up or down.  The fact that it was moving at all meant people were trading, putting transaction costs into the traders’ pockets along the way.

As it pertains to trading one should be careful when following the masses because the “m” is often silent.  Value investing and dividend farming aren’t perennial favorites of the trading crowd or the media chattering class.  Neither approach is sexy nor generates transaction churn driving money into traders’ accounts instead of yours.  However, as Graham’s record and that of his protégé attest, value investing has stood the test of time.  It’s my belief that dividend farming, which parallels and overlaps value investing in many ways, will do so, too.  Thus far, I’m pleased with the results and happy to say I’m a Dividend Farmer.

The thoughts and opinions expressed here are those of the author, who is not a financial professional.  Opinions expressed here should not be considered investment advice.  They are presented for discussion and entertainment purposes only.  For specific investment advice or assistance, please contact a registered investment advisor, licensed broker, or other financial professional.

Wednesday, October 31, 2018

Dividend Farming with DRiPs


DRIP Investing:  Secret of Successful Investing
As a fan of dividend paying companies, particularly those with long histories of dividend payouts, there’s no more valuable resource I’m aware of than DripInvesting.org and its Tools page.  If you want to find dividend champions, contenders, and challengers with stable records of dividend payments, the top of the Information column on this page is the place to start.

There you’ll find a regularly updated spreadsheet listing all U.S. companies paying dividends according to the following consecutive years of dividend distributions:
  •         Champions:  25 or more years
  •          Contenders:  10 to 24 years
  •          Challengers:  5 to 9 years
The latest update to this selection, often referred to as the CCC, is October 1, 2018.  Accordingly there are 127 Champions, 209 Contenders, and 560 Challengers on the list.  Several of the Champions have paid dividends for more than 60 consecutive years.  What’s more, you can find firms on the list that have increased their dividend payments each year for many consecutive years.

The beauty of this tool is that it incorporates far more than company name and number of years of dividend payments.  It also includes the:
  •         Stock price
  •          Yield
  •          Last dividend increase
  •          Dividend growth rate over various periods
  •          Earnings per share payout ratio
  •          Price to earnings ratio
  •          Price to book
…and other metrics helpful in evaluating the firm’s fit to your portfolio and investing style.  In short, the CCC is a great filter to help you locate solid dividend stocks to investigate further.  The additional due diligence involves another handy dividend farming tool I’ll discuss in a future blog.
Until then, it doesn’t hurt to spend time sifting through the CCC list to get started as a Dividend Farmer.

The thoughts and opinions expressed here are those of the author, who is not a financial professional.  Opinions expressed here should not be considered investment advice.  They are presented for discussion and entertainment purposes only.  For specific investment advice or assistance, please contact a registered investment advisor, licensed broker, or other financial professional.


Tuesday, October 30, 2018

72 "Rules" - The Rule of 72


Rule of 72 to Double Your InvestmentThe Rule of 72 is a handy, easy-to-use tool within the DividendFarmer’s toolbox.  It’s perfect for quickly ball-parking the time required for your investment to grow to your desired level.  For instance, you may ask yourself, “Self, if I have a $10,000 dividend portfolio with a 4% yield, how long will it take for my money to double?”

If you're familiar with the Rule of 72, you’ll know that at 4%, your money will double in about 18 years.  But what if your portfolio is paying 6%?  Then your money will double in roughly 12 years.  What if your portfolio is paying a meager 2%?  Then 36 years is the general length of time needed to double your money, left to its own devices.

So how does this Rule of 72 work?  How can you quickly determine the length of time needed for your money to double based only upon the dividend yield of your stock?  Investopedia explains the Rule of 72 in mathematical terms.  If you understand logarithmic functions, the explanation hits the spot.

However, if you’re like this Dividend Farmer, you may want a less technical explanation which starts with the principle of compound interest.  If you invest $1 today at 7%, compounded annually over several years, you will have a progression that looks something like the table below.

Start
Year 1 (end)
Year 2 (end)
Year 3 (end)
Year 4 (end)
Year 5 (end)
Year 6 (end)
Year 7 (end)
Year 8 (end)
$1.00
$1.07
$1.14
$1.22
$1.31
$1.40
$1.50
$1.60
$1.71

At the end of year 8, your investment will have grown by $.71 or 71%.  This doesn’t sound like much, but it’s only a dollar and you didn’t add anything to it.  You simply waited and watched it grow much like traditional farmers do with their crops.

Using the principle of compounding and applying the aforementioned logarithmic function, an ingenious little formula was developed, called the Rule of 72, allowing you to closely approximate the length of time needed to double your money for a given interest rate. 

Behold the magic formula:    72 / interest rate (or yield) = years to double.

Using an earlier example of 6% and applying the Rule of 72 results in the following:  72 / 6 = 12 years to double.  It’s that easy.

The best part is that you can work the formula back and forth using basic algebra to find out what interest rate is required for your money to double in a given number of years.  For instance, if I want my money to double in 10 years, what interest rate do I need to earn on my investment?

If 72 / x = 10 years then 72 / 10 equals 7.2.  This conversion actually requires a little cross multiplication, then division to put x in the right place, but it works!  I need to earn 7.2%, compounded annually, for my money to double in 10 years.

It’s not uncommon for me to contemplate the length of time it might take a dividend stock I’m investigating to double in value based upon its dividend yield.  I use the Rule of 72 when I do.  And when I had a longer time horizon, I used the formula to determine how much money I might have after a 40 year work period assuming a specific interest rate compounded annually.  By-the-way, this exercise is great for fresh college grads or industrious high schoolers as well.

For instance, after 40 years of compound interest at 4% starting with $10,000, I quickly estimated I would earn in the neighborhood of $50,000.  My napkin math went something like this.  At 4%, my money doubles in 18 years becoming $20,000.  In another 18 years (36 total) it will double again to $40,000 and I’ll still have 4 years left of the original 40.  Those 4 years represent almost 25% of a third 18 year period-to-double in which case I should see close to 25% of the $40,000 added to it during those 4 years.  Consequently, I expected to see the figure grow to approximately $50,000.  Using Excel and the Future Value (FV) formula, which we’ll talk about in another post, I can work the same problem to discover my actual earnings will be $48,010.21.  Not bad for ballpark, eh?

Some caveats are in order at this point. 

First, the Rule of 72 works well until you begin talking about very large interest rates e.g., north of 50%.  However, investment returns of that scale are infrequent and probably warrant a healthy dose of caution if ever presented to you.  Better yet, run away.   

Second, the Rule of 72 works best when investments are compounded on an annual basis.  For dividend paying stocks that distribute quarterly or monthly, the approximation given by the Rule of 72 may be slightly farther off the mark, but not so far as to be of no value.

Third, the Rule of 72 doesn’t account for additional payments you make to your investment portfolio during the compounding period.  To calculate the size of your nest egg at retirement, including compound interest and infusions of money into your investment basket for example, you’ll need to use the Future Value formula in Excel I mentioned earlier.

Fourth, and very importantly, the Rule of 72 is applicable when discussing compound growth rates – thus the heavy use of the words “compound” or “compounding” in this post.  Some financial advisors may try to bamboozle you with the Rule of 72 and average rates of return which can be VERY different from the compound growth rate used as the foundation for the Rule of 72.  The compound growth rate and average rate of return are different beasts and will be discussed in another post.

There you have it.  The Rule of 72.  It took longer for me to explain than it will for you to use once you get the hang of it, but it’s a simple, invaluable tool in the Dividend Farmer’s kit.  That’s why The Rule of 72 “Rules”.

The thoughts and opinions expressed here are those of the author, who is not a financial professional.  Opinions expressed here should not be considered investment advice.  They are presented for discussion and entertainment purposes only.  For specific investment advice or assistance, please contact a registered investment advisor, licensed broker, or other financial professional.

Monday, October 29, 2018

Portfolio: October 2018


It’s time for the monthly update on my crop’s progress which is important as a Dividend Farmer.  Since the September update, there have been no major events adversely affecting my current holdings.

Although I monitor news articles and blogs for activity that might be unfavorable to my basket of stock, I’m not checking ticker prices on a daily basis.  Doing so invites a level of consternation I don’t need.  Instead, each investment is reviewed monthly to update dividend increases, price changes, and increases in stock quantities due to reinvested dividends paid during the month.

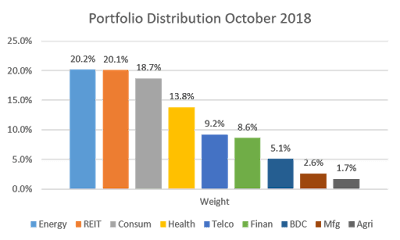
Not many changes relative to last month and no additions to principle.  However, due to dividend reinvestments in some segments, but not others, the percentages across segments have shifted slightly.  For instance, REITs were my top holding last month, but slid into second position in October.  Telco and Finance swapped rank order this month as well.  

Dividend Portfolio - October

The yield relative to current price dipped from 3.86% in September to 3.82% in October due to stock price increases across various holdings.  All dividends are automatically reinvested with no transactions fees.  Unweighted average yield on cost is approaching 4.6%; nearly 1% higher than yield on price.

The average monthly dividend from this basket is approaching $1,100.  That won’t pay all the bills, but it’ll put a nice dent in them if needed.  With a trailing 1-year CAGR of 10.6%, the long-term dividend farming strategy embarked upon 8 years ago is approaching the point of critical mass.  If you check out the Compound Growth post you’ll gain a sense of what I mean.


The thoughts and opinions expressed here are those of the author, who is not a financial professional.  Opinions expressed here should not be considered investment advice.  They are presented for discussion and entertainment purposes only.  For specific investment advice or assistance, please contact a registered investment advisor, licensed broker, or other financial professional.