Thursday, May 16, 2019

Div Tip #8: Understand how to use probability in investment analysis.

Dividend Tips Jar.
Dividend Tips

Warren Buffett employs probability analysis in his investment activities.  As his business practice developed over time so did his approach to probability analysis.  If we follow his path, it’s possible we can improve our investing performance, too.
 
The phrase “it’s possible” is an example of a probability assessment.  It represents a point of view (subjective) on the likelihood, the chance, the probability of an event happening which, in this case, is improving our investment performance.  This kind of thinking, used daily, may be honed with repetition when exploring investment opportunities to make better selections and reduce risk along the way.  The result is increased margin of safety and, in all “probability”, greater long-run returns.

Wednesday, May 15, 2019

Div Tip #7: Risk analysis improves your investing.

Dividend Tip Jar.
Dividend Tips

Conducting risk analysis is an important part of DIY investing – particularly for value investors and Dividend Farmers.  Application of risk matrices, probability, expected costs, and margin of safety are invaluable when assessing the risk of an investment.

These activities require practice, but repetition builds skill and improves the investing process.  Investment risk may be reduced and returns increased over time as proficiency and consistent application take hold and compound – just like dividends.    


"Confronted with a challenge to distill the secret of sound investment into three words, we venture the motto, Margin of Safety." -- Benjamin Graham

Monday, May 13, 2019

Invest Like Buffett: Risk reduction


During the Berkshire-Hathaway annual shareholders meeting a week ago, a questioner asked how Berkshire’s reinsurance unit priced Super Cat (super catastrophic) policies re-insuring other insurance carriers against immense losses.  Warren Buffett fielded the question from the audience and passed it to Ajit Jain, Berkshire’s Vice Chairman of reinsurance operations.  The two-part answer was instructive.

Say No:

Both Jain and Buffett said they say ‘no’ to far more opportunities than they price or accept.  In fact, Warren Buffett and Charlie Munger have stated numerous times over the years they believe they’re successful because they say no to most things.  Warren went farther saying that he and Charlie didn’t have the record they do because of any great skill they have, but because of their ability to say no to as often as they do.

This ability to say no is important to Dividend Farmers.  The financial world and media covering it are a frenzy of day-trading, impulse buying, and “act now” advice and direction.  When MSNBC, Bloomberg, Forbes, your broker, brother-in-law, and a universe of actors are telling you this is the next Apple or Amazon you shouldn’t miss, it’s a challenge to hold fire saving your investment money for select opportunities.  But that’s exactly what Warren Buffett and Ajit Jain counseled 40,000+ attendees.  Considering the record of the men involved, that’s good advice. 

Risk Mitigation:

Beyond saying no, Jain ventured into the process his team goes through in pricing Super Cat insurance.  They start with as much historical data as they can find.  They want to know all they can about the likelihood of an event, how, where, and why it may occur, and the magnitude of the consequences if it does.  Jain and team are conducting risk analysis coupled with an expected cost estimate.

Risk Assessment Matrix
The data helps them define the hazard e.g., a typhoon in a specific region, as well as the estimated probability said typhoon will happen during a given time frame.  They’re using a process analogous to the risk assessment matrix I previously blogged about. 

In the Berkshire analysis, the hazard generates a combination of likelihood and severity resulting in a risk level.  Once the is risk identified, Jain and company determine what price can be applied to account for that risk plus Berkshire’s much discussed margin of safety by baking expected cost into the equation.

Expected cost is the probability of an event happening times the cost of the event if it does.  For example, if the probability of an event happening is 1%, but the cost of the event, should it happen, be $1,000,000, the expected cost of the event is $10,000 (.01 x 1,000,000 = 10,000). 

Estimating the expected cost of a risk (part science, part art) allows Berkshire’s reinsurance group to apply a price that accounts for this cost while ensuring Berkshire remains financially healthy.  This is the margin of safety. 

In my million dollar example, an insurer may price the policy at $500 per year knowing there’s an estimated 1% chance of paying out $1,000,000 and a 99% chance of collecting $500.  If the insurer has the capacity to pay $1,000,000 in the unlikely event of such a claim, it can pocket $500 frequently with little effort and do so repeatedly while using that $500 as investment cash as it waits on possible claims payout.  This no interest ‘loan’ is what Warren frequently refers to as float. 

Castle and moat.
Economic Moat
In the case of Berkshire’s reinsurance division, the dollar figures are considerably greater allowing the firm to take on risks and expected costs no other entity has the capacity to accept.  This financial strength allows Berkshire’s reinsurance arm to capture premium business at premium prices with few competitors to drive down the price.  Talk about a financial moat!

DIY Investor Application:

Investment Research
Although this example stems from Berkshire-Hathaway and its super cat business, the principle is applicable to us DIY investors.  If I begin by reviewing as much data as possible about a prospective investment opportunity, I’m off to a good start.  Doing so helps me gain a sense of how likely the company is to provide a desired return.  The higher the desired return, the lower the likelihood it is to happen, in general, and vice versa. 

I’m establishing an expected payout (probability of return x return) against which I weigh an expected cost to invest (probability of cost x cost).   For example, if I believe the probability of a return is 80% and the return is $5 a share in dividends, my expected payout is $4 per share per year.  If my cost of investing is $50 a share and the probability of that cost happening is 100% (I buy the share) my expected cost is $50 a share with an expected return of $4 a share in a given year.  This represents an 8% return on my money which is solid.

On the risk side, if I estimate the chance of losing my $50 share is low, say 1%, then my expected cost of losing my money is .01 x $50 or 50 cents.  Against this I have an expected return of $4 which is 8 times greater than my expected cost when investing.  Probability is on my side and my risk, although not zero, is quite low.  As long as I’m capable of losing my $50 without going broke, I’ll gladly accept $4 a year in returns for the very low possibility I’ll lose the $50. 

This is the same kind of bet Ajit Jain and Warren Buffett make with super cat insurance policies and do so successfully.  If I’m going to be a better investor, learning from those who have proven highly successful themselves offers a template I’m not going to ignore.

The thoughts expressed here are those of the author, who is not a financial professional.  Opinions should not be considered investment advice.  They are presented for discussion and entertainment purposes only.  For specific investment advice or assistance, please contact a registered investment advisor, licensed broker, or other financial professional.

Sunday, May 12, 2019

5 Top Dividend Payers Going Ex-Dividend: Week of May 13, 2019.

5 Top Div Payers This Week
The top dividend paying firms going ex-dividend each day this week are listed below.  The Southern Company is a utility provider and a Dividend Contender growing its dividend payment for 18 consecutive years.  Here is the Dividend Farming Scorecard for Southern Company, January 2, 2019. 

Monday: 
Welltower Inc. 
Paying: $0.87 per share
On: May 28.

Tuesday:
American Financial Group.
Paying: $1.50 per share
On: May 28.

Wednesday:
Westpac Banking Corporation.
Paying: $0.653 per share
On: July 5.

Thursday:
Simon Property Group.
Paying: $2.05 per share
On: May 31.

Friday:
Southern Company.
Paying: $0.62 per share
On: June 6.

Thoughts expressed here are those of the author, who is not a financial professional.  These opinions should not be considered investment advice.  They are presented for discussion and entertainment purposes.  For specific investment advice or assistance, please contact a registered investment advisor, licensed broker, or other financial professional.

Friday, May 10, 2019

Div Tip #6: Compound growth is where it’s at.

Dividend Tip Jar.
Dividend Tips
The 8th Wonder of the World, according to Albert Einstein.  Genius.  No argument there.  When you couple time and compound interest through dividends as an investor, amazing things can happen.  Your portfolio grows; the growth accelerates over time; and risk is reduced as portfolio stability increases.

Consistent additions to your nest egg add up.  The more of these you capture each year and the more years you capture them, the greater the benefit.  Before you know it, you’ll reach the point of critical mass in your portfolio.  Accelerating growth helps you reach your goals earlier than you thought possible.  Compound dividend growth.  Put it to work and enjoy the ride. 

Tuesday, May 7, 2019

Compounding Periods: The more the merrier


I’ve spent time extolling the power of growth via compound interest in this blog.  The posts below demonstrate my belief in the 8th Wonder of the World and what it does for Dividend Farmers.


By definition, Dividend Farmers make full use of one of the 4 Things a Dividend Farmer Needs:  Time.

Time fuels compound growth.  Of equal importance are the number of compounding periods within the time frame.  Most investors understand the concept of time.  The longer the investment runway, the more opportunities there are for good things to happen or unfortunate things to be corrected.

The lesser known or understood factor relates to the number of compounding periods an investor can take advantage of.  Compounding periods are the segments of time within an investing horizon in which interest is accrued and reinvested to continue growing.

As examples, interest may be accrued once a year in which case it compounds annually.  Alternatively, it may be accrued four times a year resulting in quarterly compounding.  With some dividend stocks, dividends are paid (interest accrues) each month in which case those stocks compound monthly.

So what’s the difference between compounding across different periods?  If I’m being paid 4% each year, does it matter whether it’s paid out monthly, quarterly, or annually?  4% is 4%, right?  

No.  It’s not.

The following chart demonstrates the difference in outcomes for a hypothetical investor.  This person started with $1,000 and invested it in a dividend stock delivering a 4% yield.  The bar charts represent the outcome when the investment is compounded at different periods each year within a 10-year time frame.  In this example, the investor added $50 each month for the duration of the investing period.

Results for different interest compounding periods.
Compounding Periods
The blue bar depicts the ending balance after 10 years if the investor puts money into a stock paying a dividend annually.  The orange bar represents the outcome when the stock dividend is paid out each quarter and immediately reinvested for the same 10 year period.  The green bar shows the results of monthly dividend payments promptly reinvested over the 10 year time frame.

The difference in money available between the blue bar (annual compounding) and the green bar is roughly $170 dollars.  This doesn’t seem like a lot, but it represents an advantage of 2%.  If one extends the time frame to 20, 30, or even 40 years, the advantage grows further.  The table below highlights the advantage of quarterly and monthly compounding relative to the baseline of annual compounding only. 

Compounded
10 Year % Advantage
20 Year % Advantage
30 Year % Advantage
40 Year % Advantage
Monthly
2.0
2.5
3.0
3.6
Quarterly
1.6
2.0
2.5
2.9
Annually
NA
NA
NA
NA

The strength of the compounding effect distinctly increases as the number of compounding periods within an investment horizon increases.  The advantage grows stronger yet as the time horizon lengthens moving from a 2% lead at 10 years to a 3.6% lead after 40 years when compounding monthly.  

This math is precisely why good financial advisors recommend their clients start saving early and often.  This also is why Dividend Farmers seek to plant their money crops as early as possible, exercise patience and care, and cultivate for the long term.  The more compounding periods you capture the merrier you’ll be and the faster it will happen.

Thoughts expressed here are those of the author, who is not a financial professional.  These opinions should not be considered investment advice.  They are presented for discussion and entertainment purposes.  For specific investment advice or assistance, please contact a registered investment advisor, licensed broker, or other financial professional. 

Saturday, May 4, 2019

Buffett-fest 2019: 7 Reasons it was worth the trip.


The 2019 edition of Berkshire-Hathaway’s Annual Meeting is in the books.  It was a hoot.  Yesterday I posted 7 Reasons to be interested.  Today’s list includes reasons the event was not to be missed.
Berkshire-Hathaway Inc logo

2011 was the last Birkshire meeting I'd attended, but am glad I made it this year.  The crowds were enormous and the security more pronounced than I recall, but the excited vibe surrounding Berkshire, Buffett, and Munger hadn’t changed.

Below are 7 reasons I thought it was worth the trip to downtown Omaha to be part of the mass of humanity from around the world congregated to hear the Oracle and his trusted partner speak into the investment universe.

First:  Parking.  Seriously.  A handful of folks drove their RVs into the main parking area a day (maybe two?) in advance and camped, football tailgate style, near the event center.  Hotel rooms in the city near the epicenter of Berky-fest are phenomenally expensive and hard to find for a B Share guy like me.  Renting an RV for a couple days and parking it in the lot in advance is a great idea.  Less expensive than a hotel.  Easy walking distance.  And the continental breakfast may be better.

Second:  The annual movie.  It resembled a string of Super Bowl commercials featuring Berkshire companies.  It was entertaining and informative since I hadn’t kept up on acquisitions the past 8 years.  I was surprised at the Apple emphasis.  Overall, the film was good, but I still prefer the multiple celebrity cameo vignettes of years gone by.

Third:  The crowd, possibly larger than ever, was eager and well-behaved.  I’m not a fan of huge gobs of humans packed into small spaces, but the behavior and shared interest of all meant it was tolerable.

Fourth:  Charlie’s wit.  It’s sharp, concise, and wickedly accurate.  It’s a great counterpoint to Warren’s context heavy responses.

Fifth:  The breadth of knowledge and wisdom spilling forth from Warren and Charlie, elicited from question topics across the board was impressive – as usual.  From the decision process behind the pricing of super cat insurance policies to the workings of human nature in general, the ground was indeed covered.  The Q & A with aspiring young investors was kind and appreciated as well.

Flight Safety International Exhibit at Berkshire-Hathaway Meeting
Flight Safety Simulators
Sixth:  Flight Safety International’s exhibit had 10 flight simulator stations configured with virtual reality (VR) helmets for the “pilots” and big screen displays for their fans to watch.  Captivating.  Other favs included the NetJets business jet mockup available for walk-through, BNSF’s model railroad display, and the book store (I’m a nerd).


Seventh:  Dilly Bars.  They were still only $1 and didn’t disappoint.  What a great refreshment as I walked the exhibit hall taking in the buffet of Berkshire.

Anticipation at arrival was high.  The event engaged and informed.  Content satisfaction at departure provided a nice finish. 

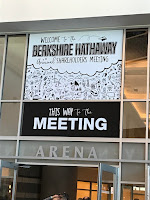
Berkshire-Hathaway meeting signage.
Birkshire Meeting Signage
Eighth (Bonus):  After leaving I swung by Eppley Airport on the way home to ogle the fleet of corporate flying iron arrayed across multiple FBOs (Fixed Base Operators).  It was a gorgeous, sunny day for airplane viewing.  Icing on the cake.
 
For so many reasons I’m glad I went to this year’s Birkshire-Hathaway meeting.  If you have the chance to attend next year’s Buffett-fest, I recommend it.  Go early if you want a good seat.  The venue fills fast.