Showing posts sorted by relevance for query compound growth. Sort by date Show all posts

Sunday, October 28, 2018

Average Growth v Compound Growth


There’s a world of difference between average annual growth and compounded growth.  The first figure is referenced by sellers peddling their wares; the second by investors with a clue.  For instance, one financial pro may direct a buyer toward a mutual fund sporting an average annual growth rate of 12% while another advisor might offer a product with an 8% compound growth rate.

Warren Buffett quote on compound interest.
Control what you can control: Compound interest.

People who aren’t informed, but happen to know that 12 is greater than 8 will invest in the vehicle with the 12% return while foregoing the item that “only” has an 8% figure associated with it.  All other things being equal, this is a mistake.  The reason is related to the post about the Rule of 72.

Here’s a simple example…

A stock is purchased for $10.  At the end of year 1 it has appreciated to $20.  This change represents an annual growth rate of 100%.  However, at the end of year 2 the stock’s price has fallen back to $10 representing a 50% decline in value.  The average annual return for the two years is therefore (100% -50%) / 2 which equals 25%.  However, you have the same $10 stock you started with 2 years earlier.  Doesn’t feel like 25% growth, does it?

Conversely, the compound growth rate of the stock would be 0% which accurately reflects the $0 change in value during that 2-year period.

Let’s work the math the other way.  If that same $10 stock appreciates at a compound rate of 8% over 2 years it would be worth $12.10 at the end of the period or $10 X [(1+.10)2-1].  The $2.10 change in value over the investment horizon represents an average annual growth rate calculated as ($2.10 / $10) / 2 years or 10.5%.

In both examples, the average annual growth rate is higher than the compounded growth rate.  The difference between the two calculations is fantastic for marketing and sales purposes, but not so hot if you’re buying because one percentage figure happens to be larger than another.

What does this difference mean over a longer investment horizon?  Let’s assume you start investing with $1,000 you received as a graduation gift from high school.  You have a choice between investing it for 10 years at an average annual growth rate of 10% or a compound growth rate of 8%.  At the 10% average annual growth rate, there will be $2,000 in your account at the end of 10 years.  You will have doubled your money.

However, if you invested it at an 8% rate compounded annually you would have $2,158.92 earning $158.92 more than you would have with the alternative.  Maybe this doesn’t sound like much of a difference to you, but when you extend the math out to 20, 30, or even 40 years of an investing life, the delta in ending values is significant.

As I’ll mention in a related post, the Rule of 72 is based upon a compound growth rate; not an average annual growth rate or average return.  There are investment advisors out there touting average annual growth rates and using them in relation to the Rule of 72.  Whether this is done out of ignorance or avarice is debatable but in either case it’s wrong and you should be aware.  Caveat emptor, indeed!  It’s better to understand in advance what’s going on than find out years later and thousands of dollars stranded on the table that you didn’t know your financial math when you plunked down your money.

The thoughts and opinions expressed here are those of the author, who is not a financial professional.  Opinions expressed here should not be considered investment advice.  They are presented for discussion and entertainment purposes only.  For specific investment advice or assistance, please contact a registered investment advisor, licensed broker, or other financial professional.

Friday, October 26, 2018

Powerful Investment Growth with Compounding


Have you dreamed of making money without doing anything?  You know, just laying around the beach with an umbrella drink in hand, knowing money is falling into your bank account as you lounge in a cabana overlooking the surf?  What if the money pouring into your bank account next week was much greater than the money going in today without so much as ordering another umbrella drink?

Ah, the life!

Ok, back to reality.  While it may not be as spectacular or compelling as the vignette above, Dividend Farming does function much the same way thanks to compounding, albeit over a longer period.  Check out the charts below to see what I mean.

The first chart shows what happens when you start with $10,000 invested in year zero at a rate of 7%.  Your money is compounded annually with a 30-year horizon.  Yes, it’s longer than a week, but stick with me.

Graph of 7% Compound Growth Curve
7% Compound Growth Curve

As you can see, your nest egg has gone from $10,000 to more than $75,000 during that period.  It’s grown more than 7.5 times and you did nothing; just watched it grow. 

The next 2 charts provide insight into the power of compound growth by measuring the slope or rate of growth during 10-year intervals along your investment curve.

Graph of 7% compound growth curve by 10 year segments.

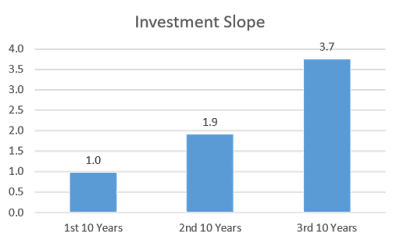
In the chart above, I stripped out the investment figures for the years between 0, 10, 20, and 30 leaving a clean, straight growth line for each period.  With a simplified curve, I calculated the slope of each 10-year interval as shown in the chart below.  The change in investment value between any two points was divided by 1,000 to reduce their scale making it easier to see and understand the differences in slope.

Bar Chart Showing Slope of Investment Curve Compounded at 7%

During the first 10-year period, the slope of investment growth was 1.0.  During the 2nd 10-year period, the slope of the line grew to 1.9, nearly doubling.  In the 3rd 10-year period, the slope of the investment growth nearly doubled again, reaching 3.7.

Here’s the key takeaway.  The power of compound growth, like that available with strong, consistent dividend paying stocks, increases over time.  The longer your investment horizon, the greater the strength you can harness. 

Exercising this power requires the patience of a Dividend Farmer.  It doesn’t mean you’ll be sipping a cool drink on a pristine beach today or tomorrow while Benjamins pour into your bank account.  However, the power of compound growth available with dividends automatically reinvested means living that beach life down the road is possible.

The thoughts and opinions expressed here are those of the author, who is not a financial professional, and therefore should not be considered as investment advice.  This information is presented for education and entertainment purposes only.  For specific investment advice or assistance, please contact a registered investment advisor, licensed broker, or other financial professional.      
 

Sunday, October 28, 2018

Compound Growth


Einstein quote on the power of compound interest.
Wisdom!
Growth is good.  Compound growth is better.  A related post outlines the difference between average annual growth and compound annual growth.  In this piece, I wanted to explore the benefits of compound growth in more depth.

One important characteristic of compound growth investors often find difficult to wrap their heads around is that compounding isn’t a straight line path to a wonderful stream of cash.  The greatest effects of compounding don’t happen right away, but at some point in the future.  The growth rate of a compounding investment accelerates over time producing a curvilinear path rather than a straight line.  This curve appears somewhat exponential, but isn’t exactly. 

While this type of curve produces solid results, it requires patience to stay the course until reaching the inflection point on the growth curve; the point at which compounding really begins to take off.  Unfortunately, many investors don’t stick with it until that acceleration point is reached, bailing out before harvesting the true gains they might have otherwise.

Here is an example of what I mean.

Dividend Growth Compounding


In this example, an investor started with $1,000.  She put her money into a dividend stock having a distinguished history paying 8% annually, letting dividends automatically reinvest each year.

You’ll notice that at the end of Year 1 she received $80 in dividends so we’ll call that 1x.  In Year 10 she received $160 dollars which was twice what she received in Year 1 so we’ll call that point 2x.  In Year 15 she received $234 which is nearly three times her Year 1 dividends in which case we’ll call that data point 3x.  Year 19 saw our investor receive $320 which is four times her Year 1 dividends so we’ll refer to that point as 4x. 

Since you get the drift, I won’t use more words, but instead post a chart.

Dividend Multiples
Years
1x
1
2x
9
3x
15
4x
19
5x
22
6x
24
7x
26
8x
28
9x
30

You’ll notice it took our investor 8 years to double her year 1 dividends, 6 more years to triple those divs, 4 additional years to quadruple them, and three years to reach 5x.  After that, she added another multiple to her original payment every 2 years. 

In the first 15 years her dividend stream compounded to triple her year 1 total.  In the second 15 year period, she saw the effects of compounding take off with her annual dividend multiple reaching 9 times hear year 1 dividend payment. 

This is what I mean about the powerful effect of compound growth not occurring out of the gate but somewhere down the track.  Consequently, it’s important for investors to stay the course.

It’s important to begin investing early and letting compound growth work for you for this reason.  If you’re a young investor or you have small children who’ll need college money in 15 to 20 years, you can do yourself a favor by putting money away early, even if it’s not a large sum.  Compounding can take a small sum and turn it into something big in the end.

By the way, if you’re wondering what the underlying principle was at various points along the way, below is a chart in which I’ve added that data.  Notice that during the 30-year period her final total is more than 10 times her original value.

Dividend Multiples
Years
Principle
1x
1
 $          1,080
2x
9
 $          1,999
3x
15
 $          3,172
4x
19
 $          4,315
5x
22
 $          5,436
6x
24
 $          6,341
7x
26
 $          7,396
8x
28
 $          8,627
9x
30
 $        10,062

Having said all that it’s true that not all dividend stocks pay 8%, nor can you be guaranteed they’ll pay out at that rate 3 decades into the future.  It’s also true that inflation will eat into the figures above.  Although nothing in life is guaranteed, some things are more likely to occur than others.  Dividend streams from solid, blue chip dividend companies are about as reliable as you’ll find in the investing world.  If they remain consistent and you are patient, the math of compounding will take care of itself and you.

The thoughts and opinions expressed here are those of the author, who is not a financial professional.  Opinions expressed here should not be considered investment advice.  They are presented for discussion and entertainment purposes only.  For specific investment advice or assistance, please contact a registered investment advisor, licensed broker, or other financial professional.


Tuesday, July 30, 2019

Why I prefer dividend growth stocks


People have asked why I prefer dividend stocks.  Let me count the ways here, here, here, and here.  The reasons summarize my preference for dividend stocks relative to alternatives.  Today I’ll outline why dividend stocks in general and div growth stocks in particular are great investments.

As a Dividend Farmer I strongly subscribe to the following wisdom. 

"The key to success [in investing] lies in avoiding losers, not in searching for winners."  
-- Howard S. Marks

"Avoiding serious loss is a precondition for sustaining a high compound rate of growth."  
-- Roger Lowenstein

"Rule #1:  Never Lose Money; Rule #2:  Never Forget Rule #1."  
-- Warren Buffett

Minimizing risks and avoiding large or frequent losses are critical to growing my nest egg.  I look for stable firms with solid cash flow inertia.  Companies with these characteristics are less risky in my opinion. 

Dividend paying stocks with long histories of payments conform to the stable, solid cash flow, low-risk category for several reasons.  Companies possessing long histories of dividend payments are good; those with long histories of dividend growth are even better.  Here’s why…

Risk Reduction

Reducing or stopping dividend growth or payments results in pain for shareholders and management.  Management teams work hard to avoid the market penalties levied on companies that interrupt their dividend streams.  Because protecting the dividend stream is important it reduces the probability the events or decisions will interrupt the stream thereby reducing investment risk.

Firms paying dividends become relatively conservative with their cash in order to protect the dividend stream.  They can’t be too conservative because that leads to problems as well, but they also become reluctant to take outsize chances with their investments.  Doing otherwise courts disaster.
 
The net result is a measured approach when it comes to corporate investment decisions; firms aren’t likely to throw barrels of cash at low probability, high payout ventures.  This means dividend growers have an inherent brake preventing their investments from hurtling down the road toward financial doom.

Cash-flow & Value Growth

Firms growing their dividend streams provide several channels for building cash value.  The more ways a firm can build value and throw off cash, the less likely there is for plateaus or value declines to occur.  This reduces risk.

Dividend firms do enjoy market appreciation.  Granted, the appreciation for dividend firms is generally lower than that of go-go growth firms.  Then again, the downside volatility for div payers and growers can be much less resulting in a superior long-term advantage for the div crowd.

If I had to assess the probability of dividends being paid out this year, next year, or in five years by a long-running div payer, I believe the odds are generally greater those dividends will continue than are the odds a non-div paying firm will enjoy consistent market appreciation over similar periods.  I’ll take the odds on consistent dividend payments over sporadic up-and-down moves in the underlying stock value every time.

This perspective is extended for dividend growth companies.  If a firm has been slowly growing its dividend each year for 25 years it’s more likely next year’s raise will occur than a market gyration will spin the stock valuation higher.  Extended over 5, 10, 15 years or more of an investing life and the delta in probability for continued dividend growth vs value appreciation widens.

Think of it in terms of expected payouts.  If the probability of a $1,000 annual dividend payment is 100% and the probability of $1,000 in stock doubling during the same year is 50% the expected payouts are $1,000 x 100% = $1,000 for the dividend and $1,000 x 50% = $500 on the strict appreciation side in year one.  Extend this scenario into years 2 through n and consider the widening gap in expected payout.  Once again, the odds are with the dividend stream vs appreciation.

Compound growth is also an important reason I prefer div growth stocks.  Compound growth can be calculated for both dividend and non-dividend payers.  With a non-div stock, however, the value may grow, but that’s it.  If you start with one share at $100 appreciating at 10% annually, you have $110 in value at the end of the first year, but only 1 share.  Value grows but ownership claims do not. 

However, if you have a dividend paying share at $100 that doesn’t appreciate, but offers a 10% dividend, you will have $110 in value at the end of one year and 1.1 shares in ownership claim.  With a dividend payer both value and ownership grow and compound, assuming you reinvest your dividends.  Firms that increase their dividend payments each year add frosting to this compounding advantage.

Forecasting

Last, but not least, I find it easier to measure, manage, and forecast reasonably high probability cash flow streams from dividends than I do the arbitrary value appreciation in the market.  The ability to measure, manage, and forecast dividend flows from a stable firm producing tangible results every quarter or month reduces my investment risk.
 
I have a better chance of predicting the future cash flow stream from a Dividend Champion over the long run than correctly guessing the value of a firm or portfolio in a year, let alone 15.  If a target is out there e.g., retirement, college fund, etc. it helps to see it and have steady aim in order to hit it.  Dividend firms offer that steady aim and dividend growers reach the target with greater speed – both of which are important in achieving my investment goals.

Tuesday, May 7, 2019

Compounding Periods: The more the merrier


I’ve spent time extolling the power of growth via compound interest in this blog.  The posts below demonstrate my belief in the 8th Wonder of the World and what it does for Dividend Farmers.


By definition, Dividend Farmers make full use of one of the 4 Things a Dividend Farmer Needs:  Time.

Time fuels compound growth.  Of equal importance are the number of compounding periods within the time frame.  Most investors understand the concept of time.  The longer the investment runway, the more opportunities there are for good things to happen or unfortunate things to be corrected.

The lesser known or understood factor relates to the number of compounding periods an investor can take advantage of.  Compounding periods are the segments of time within an investing horizon in which interest is accrued and reinvested to continue growing.

As examples, interest may be accrued once a year in which case it compounds annually.  Alternatively, it may be accrued four times a year resulting in quarterly compounding.  With some dividend stocks, dividends are paid (interest accrues) each month in which case those stocks compound monthly.

So what’s the difference between compounding across different periods?  If I’m being paid 4% each year, does it matter whether it’s paid out monthly, quarterly, or annually?  4% is 4%, right?  

No.  It’s not.

The following chart demonstrates the difference in outcomes for a hypothetical investor.  This person started with $1,000 and invested it in a dividend stock delivering a 4% yield.  The bar charts represent the outcome when the investment is compounded at different periods each year within a 10-year time frame.  In this example, the investor added $50 each month for the duration of the investing period.

Results for different interest compounding periods.
Compounding Periods
The blue bar depicts the ending balance after 10 years if the investor puts money into a stock paying a dividend annually.  The orange bar represents the outcome when the stock dividend is paid out each quarter and immediately reinvested for the same 10 year period.  The green bar shows the results of monthly dividend payments promptly reinvested over the 10 year time frame.

The difference in money available between the blue bar (annual compounding) and the green bar is roughly $170 dollars.  This doesn’t seem like a lot, but it represents an advantage of 2%.  If one extends the time frame to 20, 30, or even 40 years, the advantage grows further.  The table below highlights the advantage of quarterly and monthly compounding relative to the baseline of annual compounding only. 

Compounded
10 Year % Advantage
20 Year % Advantage
30 Year % Advantage
40 Year % Advantage
Monthly
2.0
2.5
3.0
3.6
Quarterly
1.6
2.0
2.5
2.9
Annually
NA
NA
NA
NA

The strength of the compounding effect distinctly increases as the number of compounding periods within an investment horizon increases.  The advantage grows stronger yet as the time horizon lengthens moving from a 2% lead at 10 years to a 3.6% lead after 40 years when compounding monthly.  

This math is precisely why good financial advisors recommend their clients start saving early and often.  This also is why Dividend Farmers seek to plant their money crops as early as possible, exercise patience and care, and cultivate for the long term.  The more compounding periods you capture the merrier you’ll be and the faster it will happen.

Thoughts expressed here are those of the author, who is not a financial professional.  These opinions should not be considered investment advice.  They are presented for discussion and entertainment purposes.  For specific investment advice or assistance, please contact a registered investment advisor, licensed broker, or other financial professional. 

Thursday, August 15, 2019

How to grow the rate of a dividend stream by 1% (or more)


The previous post noted that 1% is bigger than you think relative to your dividend stream and the period of time required for it to double in size.  The concept involves compound annual growth rates (CAGR) and the Rule of 72.

I finished by saying I’d share ways to increase the compound growth rate of a div stream by at least 1%.  Here goes…

Transactions Costs 

There are two items involved here.  One is the actual cost of buying a stock.  The other is a function of investment size and frequency.  I’ll take cost first.

Cost:  Brokerages have charged $4.95 to $40 per trade over the years.  Given $500 to invest, spending $4.95 of it to make the trade puts roughly $495 to work in the portfolio.  Conversely, spending $40 on a trade gets $460 into a portfolio putting it $35 (7%) behind.  And it’s not even out of the investing gate.
 
Cut Your Transactions Costs
Another way to look at it is to assume a 10% dividend (makes the math easy) on the $460 portfolio which yields $46.00.  However, reducing transactions costs from $40 to $20 through a discount broker, means $480 in the portfolio and $48.00 in dividends at the end of the year.  The $2 dollar increase from $46 to $48 represents a 4% increase in my growth rate.  This doesn’t sound like much, but if you’ll recall the last post, it can make a heck of a difference.


Investment size and frequency:  Breaking an investment amount into multiple smaller increments vs pulling the trigger on one large stock purchase can make a difference as well.  Assume a $500 investment figure.  If it’s split across 5 purchases of $100 each with a brokerage fee of $4.95 per trade it means spending $24.75 on those stock buys. 

However, saving your powder and investing all $500 in a single trade, means spending $4.95 netting an additional $19.80 going to work in a portfolio rather than a broker’s pocket.  That $19.80 provides a 4.9% head start that widens further with time.  Trading often in small amounts puts a sneaky big dent in the compound growth rate.

It’s good to be aware of trade-offs on this point.  Spreading amounts across multiple smaller purchases is how some investors prefer to diversify.  Diversification is helpful, but the law of diminishing returns on risk reduction kicks in quickly.  Weigh diversification needs against transaction cost reduction to determine which route is a better fit.

Portfolio Yield 

As with transactions costs there are a couple ways to approach this.

Portfolio Yield Sign
Portfolio Yield
Whole portfolio yield:  This is easy to explain, but difficult to pull off.  If the stocks in a portfolio are each paying 4%, trading them all in for similar stocks paying 5% results in a 1% increase in the rate at which the dividend stream compounds.  This is easy but assumes no transactions costs or capital gains taxes are involved.  Beyond that drag, finding a basket of 5 percenters meeting the investing criteria of the 4% stocks they are replacing is challenging.  Consequently, the next method is more realistic.

Portfolio mix and weighted average:  This method takes analysis and is helped by the use of Excel.  The following example is an over simplification, but it demonstrates the point.  Let’s assume a portfolio of $1000 paying 4% produces a dividend stream of $40.  Split $50 (5%) from that $1,000 and invest it in a stock paying 8%, which is possible.  The $950 investment paying 4% yields $38 and the $50 investment paying 8% yields $4 for a total of $42.  The additional $2 is a 5% increase over $40 otherwise available.

Please note some investors consider allocating dollars to high yield stocks a way of introducing additional of risk – and rightly so.  However, a small amount of risk may be acceptable for investors as long as the additional risk is applied to a small segment of a portfolio that’s big enough to move the weighted average and increase the dividend stream by 1% or more.  This is one of those times when knowing your risk tolerance is important.  So is understanding the concept of opportunity – cost which is required to weigh the added risk against the added growth.

Dividend growth stocks
Dividend Dollars Multiply

These are a favorite of value investors.  Buying offerings in this category, particularly those with long records of growth, means raising the dividend paid nearly every year just by holding the stock.  Here’s an example of what that can mean.
 
Two portfolios of $1,000.  Both pay a 4% dividend.  Portfolio A does not raise its dividend while Portfolio B does so in small increments, say 3%, each year.  “A” delivers $40 year after year assuming no reinvestment.  However, “B” delivers $40 the first year and $41.20 the second year assuming no compounding. 

As you may have guessed, portfolio B grows the dividend stream by 3% relative to portfolio A.  Imagine what this delta can do over many years as the investment portfolio grows?  Think about what happens if this growth compounds along the way because all dividends are reinvested?  Dividend growth is powerful.  It takes patience and persistence.  It’s worth it.

There are several methods Dividend Farmers can use to increase the CAGR of their dividend cash flow.  These options don’t require exceptional skill or the addition of great risk.  Better still, they can be stacked to compound the compounding.  Reducing transaction costs, purchasing dividend growth stocks, and mixing in a pinch of high yield stock with a long history of steady payments can add 1% or more to the growth rate of your dividend income stream.

Thoughts expressed here are those of the author, who is not a financial professional.  These opinions should not be considered investment advice.  They are presented for discussion and entertainment purposes.  For specific investment advice or assistance, please contact a registered investment advisor, licensed broker, or other financial professional.